 |
1 | |
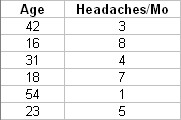
Sabariah interviewed six people who suffered from migraine headaches. She recorded the age and the average number of headaches per month for each sufferer. The results are shown. Use a scatter plot to determine what kind of relationship seems to exist between age and frequency of headaches.
 <a onClick="window.open('/olcweb/cgi/pluginpop.cgi?it=jpg::::/sites/dl/free/007092242x/118753/MATC9_Ch04_5_KeyConcepts_Quiz_Q1.jpg','popWin', 'width=NaN,height=NaN,resizable,scrollbars');" href="#"><img valign="absmiddle" height="16" width="16" border="0" src="/olcweb/styles/shared/linkicons/image.gif"> (6.0K)</a> <a onClick="window.open('/olcweb/cgi/pluginpop.cgi?it=jpg::::/sites/dl/free/007092242x/118753/MATC9_Ch04_5_KeyConcepts_Quiz_Q1.jpg','popWin', 'width=NaN,height=NaN,resizable,scrollbars');" href="#"><img valign="absmiddle" height="16" width="16" border="0" src="/olcweb/styles/shared/linkicons/image.gif"> (6.0K)</a>
|
| | A) | There appears to be no relationship. |
| | B) | As age increases, frequency of headaches increases. |
| | C) | As age increases, frequency of headaches decreases. |
| | D) | As age increases, frequency of headaches remains the same. |
|
|
2 | |
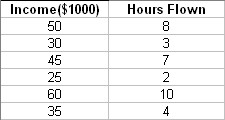
Dave polled his fellow pilots. He recorded annual income, to the nearest thousand dollars, and how many hours each flew per month, on the average. The results are shown. Use a scatter plot to determine what kind of relationship seems to exist between annual income and frequency of flying.
 <a onClick="window.open('/olcweb/cgi/pluginpop.cgi?it=jpg::::/sites/dl/free/007092242x/118753/MATC9_Ch04_5_KeyConcepts_Quiz_Q2.jpg','popWin', 'width=NaN,height=NaN,resizable,scrollbars');" href="#"><img valign="absmiddle" height="16" width="16" border="0" src="/olcweb/styles/shared/linkicons/image.gif"> (7.0K)</a> <a onClick="window.open('/olcweb/cgi/pluginpop.cgi?it=jpg::::/sites/dl/free/007092242x/118753/MATC9_Ch04_5_KeyConcepts_Quiz_Q2.jpg','popWin', 'width=NaN,height=NaN,resizable,scrollbars');" href="#"><img valign="absmiddle" height="16" width="16" border="0" src="/olcweb/styles/shared/linkicons/image.gif"> (7.0K)</a>
|
| | A) | There appears to be no relationship. |
| | B) | As income increases, frequency of flying increases. |
| | C) | As income increases, frequency of flying decreases. |
| | D) | As income increases, frequency of flying remains the same. |
|
|
3 | |
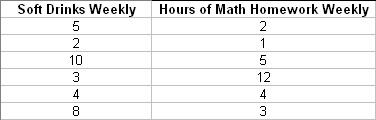
Shawna polled her classmates. She recorded how many soft drinks each consumed per week, on the average, and how many hours of mathematics homework each did, on the average. The results are shown. Use a scatter plot to determine what kind of relationship seems to exist between soft drinks consumed and hours of mathematics homework done.
 <a onClick="window.open('/olcweb/cgi/pluginpop.cgi?it=jpg::::/sites/dl/free/007092242x/118753/MATC9_Ch04_5_KeyConcepts_Quiz_Q3.jpg','popWin', 'width=NaN,height=NaN,resizable,scrollbars');" href="#"><img valign="absmiddle" height="16" width="16" border="0" src="/olcweb/styles/shared/linkicons/image.gif"> (10.0K)</a> <a onClick="window.open('/olcweb/cgi/pluginpop.cgi?it=jpg::::/sites/dl/free/007092242x/118753/MATC9_Ch04_5_KeyConcepts_Quiz_Q3.jpg','popWin', 'width=NaN,height=NaN,resizable,scrollbars');" href="#"><img valign="absmiddle" height="16" width="16" border="0" src="/olcweb/styles/shared/linkicons/image.gif"> (10.0K)</a>
|
| | A) | There appears to be no relationship. |
| | B) | As soft drink consumption increases, hours of mathematics homework increases. |
| | C) | As soft drink consumption increases, hours of mathematics homework decreases. |
| | D) | As soft drink consumption increases, hours of mathematics homework remains the same. |
|