 |
| 1 | |
Sandy constructed a household budget with categories for mortgage payments, repairs, utilities, and maintenance. If she wanted to compare the cost of repairs with the total expenditure on these items, which type of graph would be most appropriate? |
| | A) | bar graph |
| | B) | circle graph |
| | C) | line graph |
| | D) | pictograph |
|
|
|
| 2 | |
Dave and Sunita have hockey card collections, each specializing in the same six teams. Suppose that they wanted to compare their holdings for each team. What is the best choice of graph? |
| | A) | two circle graphs |
| | B) | two pictographs |
| | C) | double bar graph |
| | D) | double line graph |
|
|
|
| 3 | |
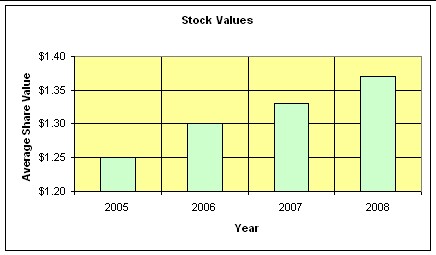
An investment broker placed an ad in the local paper claiming "Huge Increase in Stock Values". How does this graph make the rise in value seem larger than it really is?
 <a onClick="window.open('/olcweb/cgi/pluginpop.cgi?it=jpg::::/sites/dl/free/0070973385/505858/ML8_ch1_quiz_ques3.jpg','popWin', 'width=NaN,height=NaN,resizable,scrollbars');" href="#"><img valign="absmiddle" height="16" width="16" border="0" src="/olcweb/styles/shared/linkicons/image.gif"> (16.0K)</a> <a onClick="window.open('/olcweb/cgi/pluginpop.cgi?it=jpg::::/sites/dl/free/0070973385/505858/ML8_ch1_quiz_ques3.jpg','popWin', 'width=NaN,height=NaN,resizable,scrollbars');" href="#"><img valign="absmiddle" height="16" width="16" border="0" src="/olcweb/styles/shared/linkicons/image.gif"> (16.0K)</a> |
| | A) | The vertical scale does not start at zero. |
| | B) | The number intervals on the horizontal scale are not equal. |
| | C) | The bars are of different widths. |
| | D) | The number intervals on the vertical scale are not equal. |
|
|
|
| 4 | |
 <a onClick="window.open('/olcweb/cgi/pluginpop.cgi?it=jpg::::/sites/dl/free/0070973385/505858/ML8_ch1_quiz_ques4.jpg','popWin', 'width=NaN,height=NaN,resizable,scrollbars');" href="#"><img valign="absmiddle" height="16" width="16" border="0" src="/olcweb/styles/shared/linkicons/image.gif"> (3.0K)</a> <a onClick="window.open('/olcweb/cgi/pluginpop.cgi?it=jpg::::/sites/dl/free/0070973385/505858/ML8_ch1_quiz_ques4.jpg','popWin', 'width=NaN,height=NaN,resizable,scrollbars');" href="#"><img valign="absmiddle" height="16" width="16" border="0" src="/olcweb/styles/shared/linkicons/image.gif"> (3.0K)</a>
Bert's Burgers and Tanya's Takeout participated in a "favourite burger" survey. A pictograph represented the 90 customers who voted for Bert's Burgers as shown. If 60 customers voted for Tanya's Takeout, how many burger images should be shown in the pictograph? |
| | A) | 3 |
| | B) | 4 |
| | C) | 5 |
| | D) | 8 |
|
|
|
| 5 | |
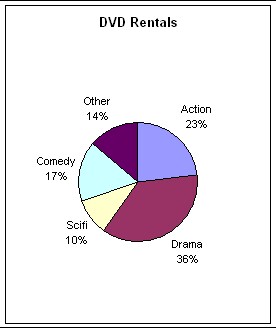
DVD rentals at Fancy Flicks Entertainment are shown.
 <a onClick="window.open('/olcweb/cgi/pluginpop.cgi?it=jpg::::/sites/dl/free/0070973385/505858/ML8_ch1_quiz_ques5.jpg','popWin', 'width=NaN,height=NaN,resizable,scrollbars');" href="#"><img valign="absmiddle" height="16" width="16" border="0" src="/olcweb/styles/shared/linkicons/image.gif"> (12.0K)</a> <a onClick="window.open('/olcweb/cgi/pluginpop.cgi?it=jpg::::/sites/dl/free/0070973385/505858/ML8_ch1_quiz_ques5.jpg','popWin', 'width=NaN,height=NaN,resizable,scrollbars');" href="#"><img valign="absmiddle" height="16" width="16" border="0" src="/olcweb/styles/shared/linkicons/image.gif"> (12.0K)</a>
If a total of 246 DVDs were rented, about how many were either comedy or scifi? |
| | A) | 17 |
| | B) | 25 |
| | C) | 42 |
| | D) | 66 |
|
|
|
| 6 | |
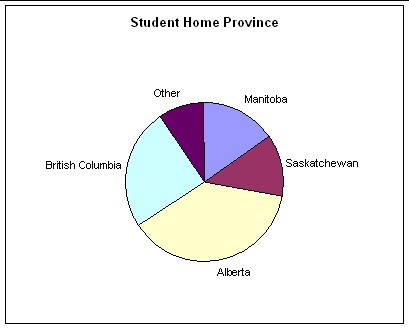
Students attending a Western Chess Tournament were surveyed regarding their home provinces or territories. The results are shown. What is the ratio between the number from Alberta and the number from Saskatchewan?
 <a onClick="window.open('/olcweb/cgi/pluginpop.cgi?it=jpg::::/sites/dl/free/0070973385/505858/ML8_ch1_quiz_ques6.jpg','popWin', 'width=NaN,height=NaN,resizable,scrollbars');" href="#"><img valign="absmiddle" height="16" width="16" border="0" src="/olcweb/styles/shared/linkicons/image.gif"> (15.0K)</a> <a onClick="window.open('/olcweb/cgi/pluginpop.cgi?it=jpg::::/sites/dl/free/0070973385/505858/ML8_ch1_quiz_ques6.jpg','popWin', 'width=NaN,height=NaN,resizable,scrollbars');" href="#"><img valign="absmiddle" height="16" width="16" border="0" src="/olcweb/styles/shared/linkicons/image.gif"> (15.0K)</a> |
| | A) | 1:1 |
| | B) | 2:1 |
| | C) | 3:1 |
| | D) | The ratio cannot be determined without the percent shown. |
|
|
|
| 7 | |
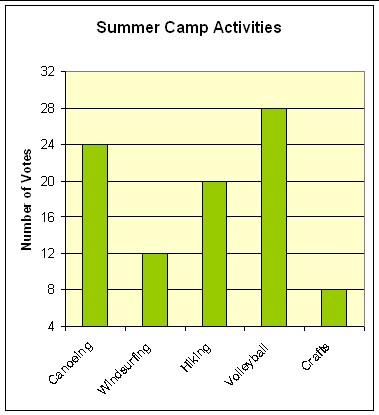
The bar graph shows the result of a survey on favourite camp activities. Which conclusion is correct?
 <a onClick="window.open('/olcweb/cgi/pluginpop.cgi?it=jpg::::/sites/dl/free/0070973385/505858/ML8_ch1_quiz_ques7.jpg','popWin', 'width=NaN,height=NaN,resizable,scrollbars');" href="#"><img valign="absmiddle" height="16" width="16" border="0" src="/olcweb/styles/shared/linkicons/image.gif"> (23.0K)</a> <a onClick="window.open('/olcweb/cgi/pluginpop.cgi?it=jpg::::/sites/dl/free/0070973385/505858/ML8_ch1_quiz_ques7.jpg','popWin', 'width=NaN,height=NaN,resizable,scrollbars');" href="#"><img valign="absmiddle" height="16" width="16" border="0" src="/olcweb/styles/shared/linkicons/image.gif"> (23.0K)</a> |
| | A) | Canoeing received twice as many votes as windsurfing. |
| | B) | Windsurfing received twice as many votes as crafts. |
| | C) | The ratio of votes between canoeing and crafts was 5:1. |
| | D) | All of these conclusions are correct. |
|
|
|
| 8 | |
Chantal's class won a class pizza lunch. If five of the students in the class of 25 voted for a vegetarian pizza, what percent of a circle graph would represent their wishes? |
| | A) | 80% |
| | B) | 50% |
| | C) | 25% |
| | D) | 20% |
|
|
|
| 9 | |
Mr. Pradhan's class sold 125 magazine subscriptions, while Ms. Schneider's class sold 150 subscriptions. How can you draw a bar graph that would appear to show that Ms. Schneider's class sold twice as many as Mr. Pradhan's class? |
| | A) | Start the scale of the vertical axis at 0, and assign a value of 25 to each "tick". |
| | B) | Start the scale of the vertical axis at 100, and assign a value of 25 to each "tick". |
| | C) | Show the width of the bar representing Ms. Schneider's class as half of the width of the bar representing Mr. Pradhan's class. |
| | D) | Draw the bar graph horizontally, starting the horizontal scale at 0. |
|
|
|
| 10 | |
A line graph was used to represent the number of robins seen at a bird feeder each day for a week. Which type of graph could best show the percentage of birds that appeared each day? |
| | A) | bar graph |
| | B) | circle graph |
| | C) | double bar graph |
| | D) | pictograph |
|
|