 |
| 1 | |
For a stem-and-leaf display |
| | A) | Arrange the leaf values from smallest to largest. |
| | B) | Make sure the stem value is only one digit. |
| | C) | Do not allow stems with no leaf values. |
| | D) | Include decimal points. |
|
|
|
| 2 | |
Questions 2 to 6 refer to the following information. It reports the number of TV sets sold per day at the Appliance SuperStore. 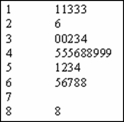 <a onClick="window.open('/olcweb/cgi/pluginpop.cgi?it=jpg::::/sites/dl/free/0073401765/663702/C4_img1.jpg','popWin', 'width=NaN,height=NaN,resizable,scrollbars');" href="#"><img valign="absmiddle" height="16" width="16" border="0" src="/olcweb/styles/shared/linkicons/image.gif"> (6.0K)</a> <a onClick="window.open('/olcweb/cgi/pluginpop.cgi?it=jpg::::/sites/dl/free/0073401765/663702/C4_img1.jpg','popWin', 'width=NaN,height=NaN,resizable,scrollbars');" href="#"><img valign="absmiddle" height="16" width="16" border="0" src="/olcweb/styles/shared/linkicons/image.gif"> (6.0K)</a>
The above arrangement is called a |
| | A) | Frequency distribution |
| | B) | A frequency polygon |
| | C) | A pie chart |
| | D) | A stem-and-leaf chart. |
|
|
|
| 3 | |
<a onClick="window.open('/olcweb/cgi/pluginpop.cgi?it=jpg::::/sites/dl/free/0073401765/663702/C4_img1.jpg','popWin', 'width=NaN,height=NaN,resizable,scrollbars');" href="#"><img valign="absmiddle" height="16" width="16" border="0" src="/olcweb/styles/shared/linkicons/image.gif"> (6.0K)</a>
How many days were studied? |
| | A) | 11 |
| | B) | 30 |
| | C) | 50 |
| | D) | None of the above |
|
|
|
| 4 | |
<a onClick="window.open('/olcweb/cgi/pluginpop.cgi?it=jpg::::/sites/dl/free/0073401765/663702/C4_img1.jpg','popWin', 'width=NaN,height=NaN,resizable,scrollbars');" href="#"><img valign="absmiddle" height="16" width="16" border="0" src="/olcweb/styles/shared/linkicons/image.gif"> (6.0K)</a>
What was the smallest and largest number of sets sold per day? |
| | A) | 1, 8 |
| | B) | 10, 80 |
| | C) | 11, 88 |
| | D) | None of the above |
|
|
|
| 5 | |
<a onClick="window.open('/olcweb/cgi/pluginpop.cgi?it=jpg::::/sites/dl/free/0073401765/663702/C4_img1.jpg','popWin', 'width=NaN,height=NaN,resizable,scrollbars');" href="#"><img valign="absmiddle" height="16" width="16" border="0" src="/olcweb/styles/shared/linkicons/image.gif"> (6.0K)</a>
How many days were there less than 30 sets sold? |
| | A) | 15 |
| | B) | 6 |
| | C) | 30 |
| | D) | None of the above |
|
|
|
| 6 | |
<a onClick="window.open('/olcweb/cgi/pluginpop.cgi?it=jpg::::/sites/dl/free/0073401765/663702/C4_img1.jpg','popWin', 'width=NaN,height=NaN,resizable,scrollbars');" href="#"><img valign="absmiddle" height="16" width="16" border="0" src="/olcweb/styles/shared/linkicons/image.gif"> (6.0K)</a>
The actual number of sets sold per day between 60 and 69 is |
| | A) | 65, 66, 67, 68, 68 |
| | B) | 60, 69 |
| | C) | Cannot tell from the information given |
| | D) | None of the above |
|
|
|
| 7 | |
To draw a box plot that summarizes a data set, |
| | A) | Two values are required: 1st quartile, 3rd quartile, |
| | B) | Three values are required: minimum, median, and maximum |
| | C) | Four values are required: minimum, 1st quartile, 3rd quartile, and maximum |
| | D) | Five values are required: minimum, 1st quartile, median, 3rd quartile, and maximum |
|
|
|
| 8 | |
The inter quartile range of a set of observations is |
| | A) | The difference between the minimum and maximum values |
| | B) | The standard deviation. |
| | C) | The difference between the 1st and 3rd quartiles. |
| | D) | Appropriate only for symmetric distributions. |
|
|
|
| 9 | |
For any symmetric distribution |
| | A) | The mean, median, and mode are equal. |
| | B) | The mean is the largest measure of location. |
| | C) | The median is the largest measure of location. |
| | D) | The standard deviation is the largest value. |
|
|
|
| 10 | |
A coefficient of skewness of -2.73 was computed for a set of data. We conclude that |
| | A) | The mean is larger than the median. |
| | B) | The median is larger than the mean. |
| | C) | The standard deviation is a negative number. |
| | D) | Something is wrong because the coefficient of skewness cannot be less than -1.00. |
|
|
|
| 11 | |
The purpose of a contingency table is to summarize |
| | A) | Two continuous, ratio variables |
| | B) | Two discrete, ratio variables |
| | C) | Two discrete, nominal or ordinal variables. |
| | D) | Two discrete, continuous variables. |
|
|
|
| 12 | |
A scatter diagram: |
| | A) | Is a graphic tool designed to portray the relationship between variables. |
| | B) | Uses interval or ratio scale data. |
| | C) | Does not allow negative values. |
| | D) | Both A and B are correct. |
|
|