 |
| 1 | |
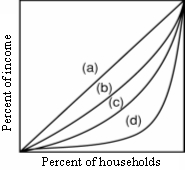
Use the following diagram to answer the next question.
 <a onClick="window.open('/olcweb/cgi/pluginpop.cgi?it=jpg::::/sites/dl/free/0077337735/883748/ch20_q1.jpg','popWin', 'width=NaN,height=NaN,resizable,scrollbars');" href="#"><img valign="absmiddle" height="16" width="16" border="0" src="/olcweb/styles/shared/linkicons/image.gif"> (14.0K)</a> <a onClick="window.open('/olcweb/cgi/pluginpop.cgi?it=jpg::::/sites/dl/free/0077337735/883748/ch20_q1.jpg','popWin', 'width=NaN,height=NaN,resizable,scrollbars');" href="#"><img valign="absmiddle" height="16" width="16" border="0" src="/olcweb/styles/shared/linkicons/image.gif"> (14.0K)</a>
Refer to the diagram. Suppose the economy's income distribution is represented by line b. An increase in income inequality would be represented by a movement: |
| | A) | to line a. |
| | B) | up and to the right along line b. |
| | C) | to line c. |
| | D) | down and to the left along line b. |
|
|
|
| 2 | |
In 2008, approximately how much income was required for a household to reach the highest quintile? |
| | A) | $48,000 |
| | B) | $100,000 |
| | C) | $176,000 |
| | D) | $475,000 |
|
|
|
| 3 | |
Since 1970, the U.S. distribution of income has: |
| | A) | remained essentially the same, although the distribution of wealth has become substantially more unequal. |
| | B) | exhibited a substantial decrease in income mobility. |
| | C) | become less unequal, partly owing to the falling returns from education. |
| | D) | become more unequal, partly owing to increased demand for highly skilled workers. |
|
|
|
| 4 | |
Because economic discrimination arbitrarily blocks women and minorities from higher productivity jobs, discrimination: |
| | A) | creates inflation. |
| | B) | reduces overall productivity. |
| | C) | redistributes income but does not reduce it overall. |
| | D) | moves an economy downward along its production possibilities frontier. |
|
|
|
| 5 | |
In 2008, the share of income accruing to households in the bottom quintile was: |
| | A) | less than 1%. |
| | B) | between 3% and 4%. |
| | C) | larger than it was in 1970. |
| | D) | the same as the share of income accruing to households in the middle quintile. |
|
|
|
| 6 | |
One can make a logical case for redistributing income from rich to poor by arguing that: |
| | A) | the total utility of income for the rich exceeds that of the poor. |
| | B) | the marginal utility of income for the poor exceeds that of the rich. |
| | C) | income redistribution increases the incentives to work. |
| | D) | income redistribution helps to fill up poor persons' leaky buckets. |
|
|
|
| 7 | |
Compared to annual incomes, lifetime incomes exhibit: |
| | A) | less inequality, reflecting substantial income mobility. |
| | B) | more inequality, reflecting substantial income mobility. |
| | C) | more inequality, reflecting very little income mobility. |
| | D) | about the same inequality, reflecting very little income mobility. |
|
|
|
| 8 | |
Regarding the effect of taxes and transfer payments on the U.S. income distribution, data indicate that: |
| | A) | there is virtually no impact. |
| | B) | the progressive tax system accounts for over half of the reduction in income inequality. |
| | C) | tax rebates and credits account for over half of the income of those in the lowest quintile. |
| | D) | most of the reduction in income inequality is attributable to transfer payments. |
|
|
|
| 9 | |
Which of the following is the basic welfare program for low-income families in the U.S.? |
| | A) | OASDHI |
| | B) | SSI |
| | C) | TANF |
| | D) | EITC |
|
|
|
| 10 | |
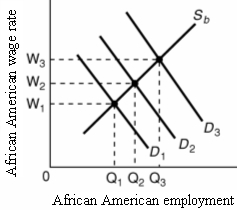
Use the following diagram of the market for African American workers to answer the next question:
 <a onClick="window.open('/olcweb/cgi/pluginpop.cgi?it=jpg::::/sites/dl/free/0077337735/883748/ch20_q10.jpg','popWin', 'width=NaN,height=NaN,resizable,scrollbars');" href="#"><img valign="absmiddle" height="16" width="16" border="0" src="/olcweb/styles/shared/linkicons/image.gif"> (21.0K)</a> <a onClick="window.open('/olcweb/cgi/pluginpop.cgi?it=jpg::::/sites/dl/free/0077337735/883748/ch20_q10.jpg','popWin', 'width=NaN,height=NaN,resizable,scrollbars');" href="#"><img valign="absmiddle" height="16" width="16" border="0" src="/olcweb/styles/shared/linkicons/image.gif"> (21.0K)</a>
Refer to the diagram: Suppose demand is initially given by D2. Which of the following would shift demand to D3? |
| | A) | A decrease in the productivity of African American workers |
| | B) | A reduction in white employers' discrimination coefficients |
| | C) | An increase in white employers' discrimination coefficients |
| | D) | A reduction in employment discrimination coupled with an increase in statistical discrimination |
|
|