(See related pages)
Floods Devastate Coastal Mozambique
March 2000 Limpopo River, Mozambique Floods in Mozambique made international news repeatedly during early March 2000. This is the summer rainy season in southern Africa, and flooding is not unusual in the flat coastal terrain of Mozambique. At the same time, populations have grown in recent years, and settlement has increased in the river's floodplain. This year the Limpopo and Changane rivers were especially high because of heavy rains. More than 30,000 people were displaced, many of them needing to be rescued by helicopter from trees and housetops where they had climbed to escape the floodwaters. In early March, the Red Cross reported that more than 250,000 acres of farm fields, including one-third of the year's staple corn crop, had washed away. Even topsoil was reportedly lost in some farming areas. Unknown numbers of people, as well as tens of thousands of cattle, drowned. In an impoverished country with a large population of peasant farmers, such destruction is very difficult to cope with. The floods subsided after a week or more, leaving towns, roads, and bridges demolished. Worries of malaria and water-borne diseases also increased in the aftermath of the floods as standing water and decaying debris provided breeding grounds for mosquitoes and parasites. A longer-term consequence of this year's flooding may be increased international aid for damming these rivers. Already Mozambique's leaders are calling for assistance in building dams that will help control floods in the future. Other regions of the world have suffered serious environmental and health consequences from the construction of major dams. However, in the aftermath of a dramatic and destructive flood, these more subtle consequences are likely to be overlooked. To learn more, see these related websites: News from the Mozambique Embassy in the United States News from the U.S. embassy in Mozambique To read more, see: Environmental Science, A Global Concern, Cunningham and Saigo, 6th ed. Environmental Science, A Study of Interrelationships, Enger and Smith, 7th
ed. More Large Icebergs Calve from Antarctica's Ice Shelves May, 2000 Antarctica
The biggest ice chunk ever recorded broke off the Antarctic ice sheet during the Antarctic summer of 2000. The iceberg, called B-15, broke off the Ross Ice Shelf on March 23. At 183 miles long and 23 miles wide, the B-15 iceberg was as large as the Bahamas. Three other large chunks (A-43A, A-43B, and A-44) broke off in early May. The sizes of the three May icebergs, recorded by the National Ice Center on May 10, 2000, are as follows: A-43A: 107 x 21 statute miles (168 x 33 km) Over the past several years, an unusual number of large icebergs have broken off from the Ross and Ronne Ice Shelves, the two largest ice shelves on the continent. Opinions differ on the seriousness of the loss of these ice sections in the Antarctic ice fields. Many scientists concerned with global warming believe ice losses represent early stages of warming and sea-level rise. By contrast, scientists monitoring Antarctic ice for the National Ice Center caution that the Ronne Ice Shelf is probably just returning to earlier extents, and that the shifting edge of the ice shelves is a result of normal fluctuation of temperature and precipitation. No signs of actual temperature increases have been found in this part of Antarctica. However, in other parts of the continent---especially the Antarctic Peninsula, the northernmost portion of the continent---warming and ice loss are significant and rapid. There, ecologists are concerned that warm waters are disrupting nutrient movement and food webs. The icebergs generally break up as they move north into warmer waters, so they pose little danger to navigation. Ice shelves and calving icebergs are monitored by the National Ice Center, National Oceanic and Atmospheric Administration (NOAA), and other agencies, using images from satellites launched to monitor weather and other conditions on the earth's surface. To learn more, see these related websites: Antarctic ice shelves, from the National Snow and Ice Data Center The National Snow and Ice Data Center (NSIDC) University of Wisconsin's Antarctic Meteorology Research Center To read more, see: Environmental Science, A Global Concern, Cunningham and Saigo, 6th ed. Environmental Science, A Study of Interrelationships, Enger and Smith, 7th
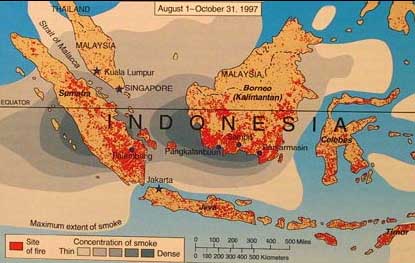
ed. A Plague of Smoke For several months during the unusually dry El Niño winter of 1997-98, a thick pall of smoke covered much of Southeast Asia. Generated primarily by thousands of forest fires on the Indonesian islands of Kalimantan (Borneo) and Sumatra, the smoke spread over eight countries and 75 million people, covering an area larger than Europe (fig. 1). The air quality in Singapore and the city of Kuala Lumpur, Malaysia, just across the Strait of Malacca from Indonesia, was worse than any industrial region in the world. In towns such as Palembang, Sumatra, and Banjarmasin, Kalimantan, in the heart of the massive conflagration, the air pollution index frequently passed 800, twice the level classified in the United States as an air quality emergency, hazardous to human health. An estimated 20 million people were treated for illnesses such as asthma, bronchitis, emphysema, eye irritation, and cardiovascular diseases, while those who couldn't afford medical care went uncounted. The number of excess deaths from this months-long episode is unknown. Unable to see through the thick haze, several boats collided in the busy Straits of Malacca, and a plane crashed on Sumatra, killing 234 passengers. Cancelled airline flights, aborted tourist plans, lost workdays, medical bills, and ruined crops are estimated to have cost countries in the afflicted area several billion dollars. Wildlife suffered as well. In addition to the loss of habitat destroyed by fires, breathing the noxious smoke was as hard on wild species as it was on people. At the Pangkalanbuun Conservation Reserve, weak and disoriented orangutans were found suffering from respiratory diseases much like those of humans. Indonesia has the second largest expanse of tropical forest and the highest number of endemic species in the world, so fires there are of special concern. The dry season in tropical Southeast Asia has probably always been a time of burning vegetation and smoky skies. Tinder-dry forests are ignited by lightning or fires set by farmers to clear cropland. Generally burning only a hectare or two at a time, traditional shifting cultivators often help preserve plant and animal species by opening up space for early successional forest stages. Globalization and the advent of large, commercial plantations, however, have changed everything. Although Indonesian government officials blamed the fires on small-scale farmers and indigenous people, environmental groups gathered evidence that most of the burning was caused by large agribusiness conglomerates with close ties to the government and military. Clear-cutting hardwoods for sale abroad and burning what's left to make way for huge oil-palm plantations and fast-growing pulpwood trees, these companies ignore forest protection laws. Altogether, a couple of dozen businesses owned by wealthy entrepreneurs with friends in high places are thought to be responsible for burning some 20,000 km2 (8000 mi2) in 1997, or an area about the size of New Jersey. Conditions in Indonesia in 1997 were extreme, but forest fires and other human activities in many places around the world also cause degraded air quality. Since we all breathe air, it is important to understand how air pollution arises, why it is dangerous, and what we might do about it. Studying this chapter will help you learn about this vital topic.
FIGURE 18.1 Thousands of fires (red dots) in Indonesia in 1997 spread a thick cloud of smoke over an area larger than Europe. Source: Data from NOAA and NASA.
|